Visitors
This section displays the most active users and groups by their login hours. The Visitor section consists of the following tabs:
• Registered Users
• Groups
Select these tabs to open the related sections of the Geospatial Statistics dashboard.
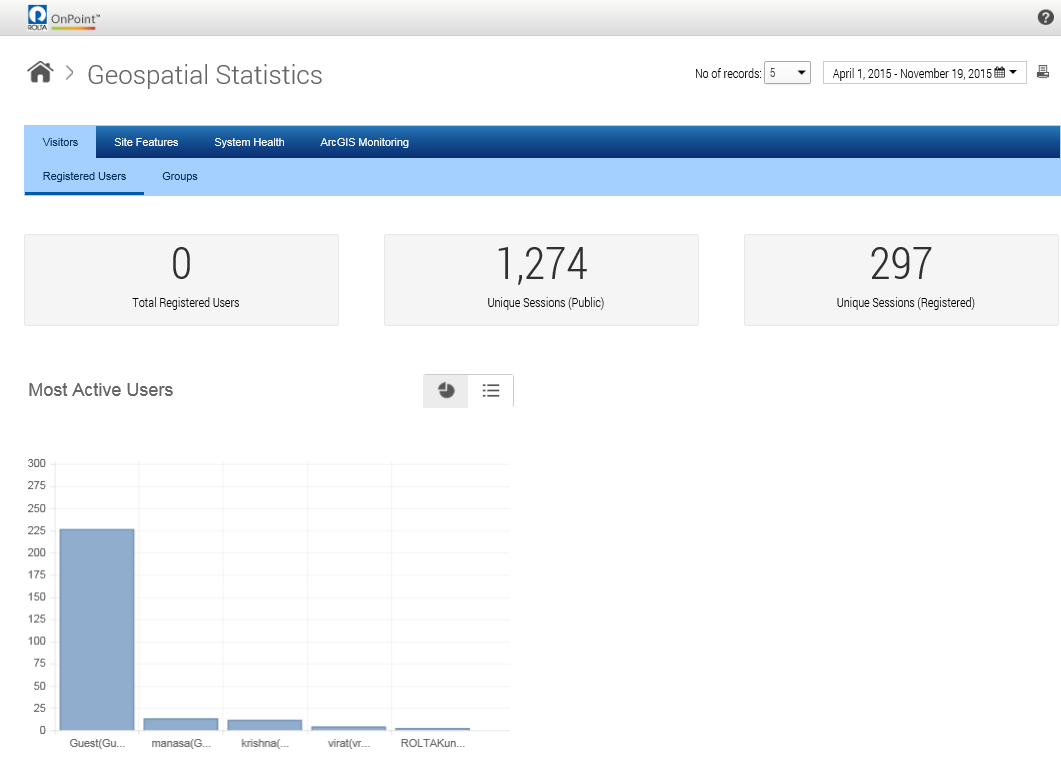
Registered Users
This section displays user statistics such as the total number of registered users, the number of unique sessions by public and registered users, and most active users by their login hours.
Groups
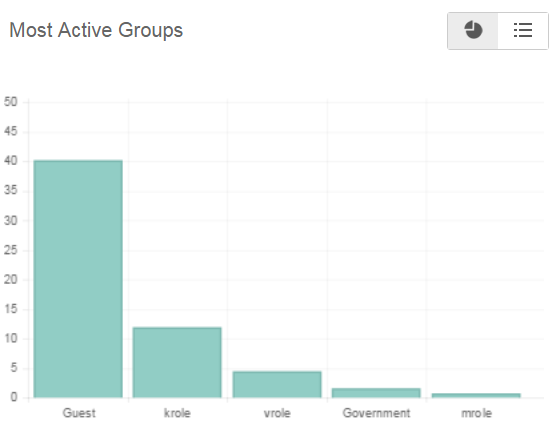
This section displays the following reports:
• Most active groups
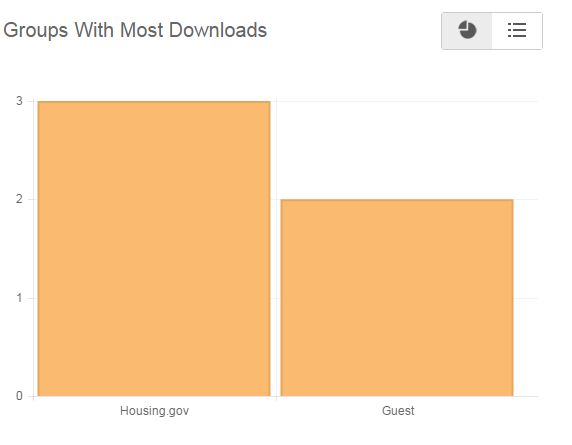
• Groups with most downloads
• Groups with most prints
• Groups with most uploads
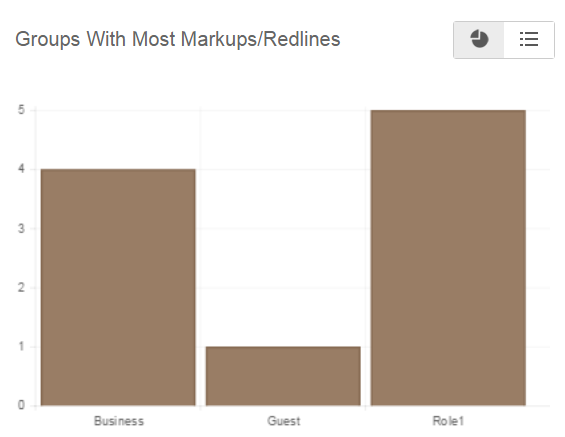
• Groups with most markups/redlines
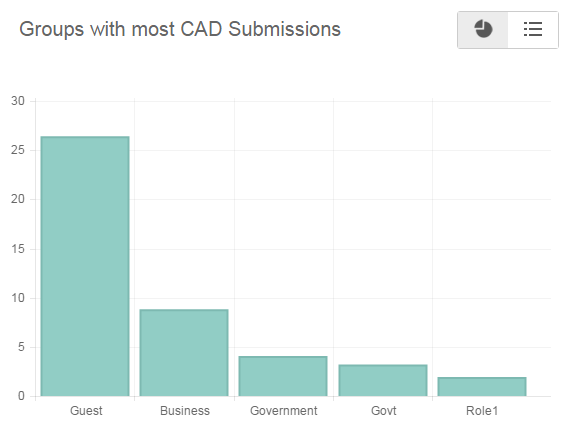
• Groups with most CAD submissions
A few examples of the reports displayed in the Group section are listed below. In these examples, the reports are in graphical format. For more information on viewing reports in different formats, see
Viewing the Reports in Tabular and Graphical Format.