Site Features
This section displays reports and statistics related to the maps, products, layers, searches, markups, CAD submissions and conversions, and downloads.
These reports can categorized under the following tabs in the Site Feature section:
• Overview
• Products
• Maps
• Layers
• Searches
• Markups
• CAD
• Downloads
Select these tabs to open the related sections of the Geoportal Statistics dashboard.
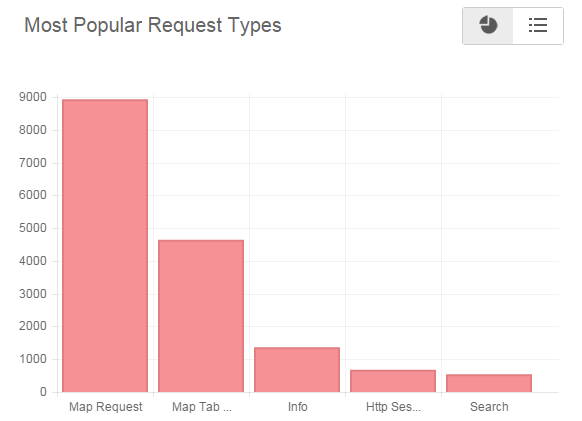
Overview
This section displays the most popular request types by the number of hits received for each request type.
In this example, the report is in graphical format. For more information on viewing reports in different formats, see
Viewing the Reports in Tabular and Graphical Format.
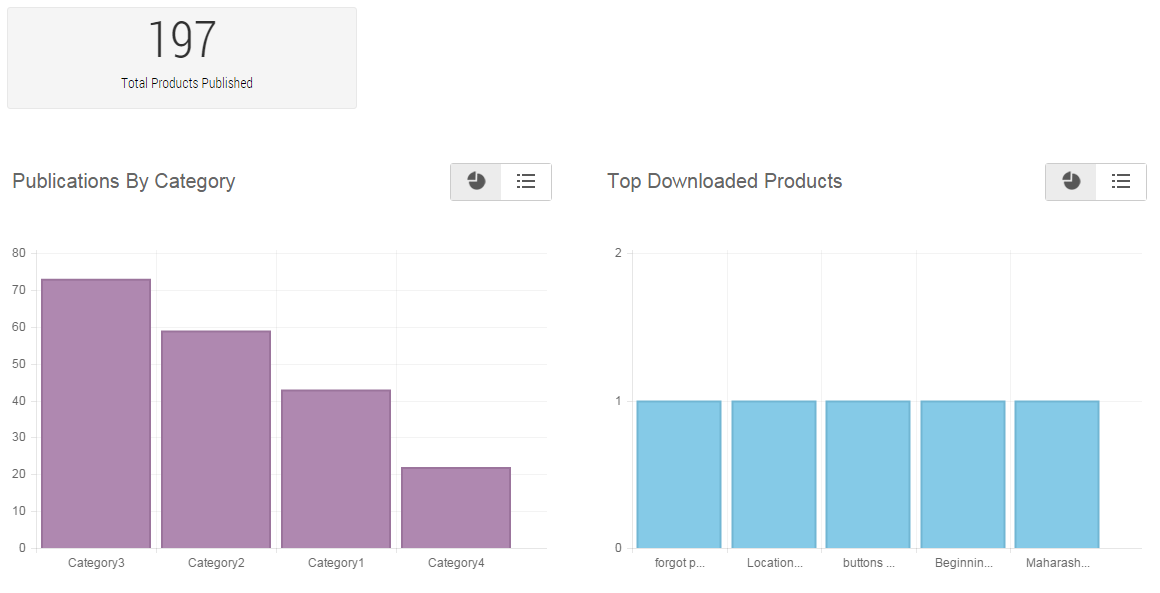
Products
This section displays the total number of published products, publications by their category and most downloaded products.
In this example, the reports are in graphical format. For more information on viewing reports in different formats, see
Viewing the Reports in Tabular and Graphical Format.
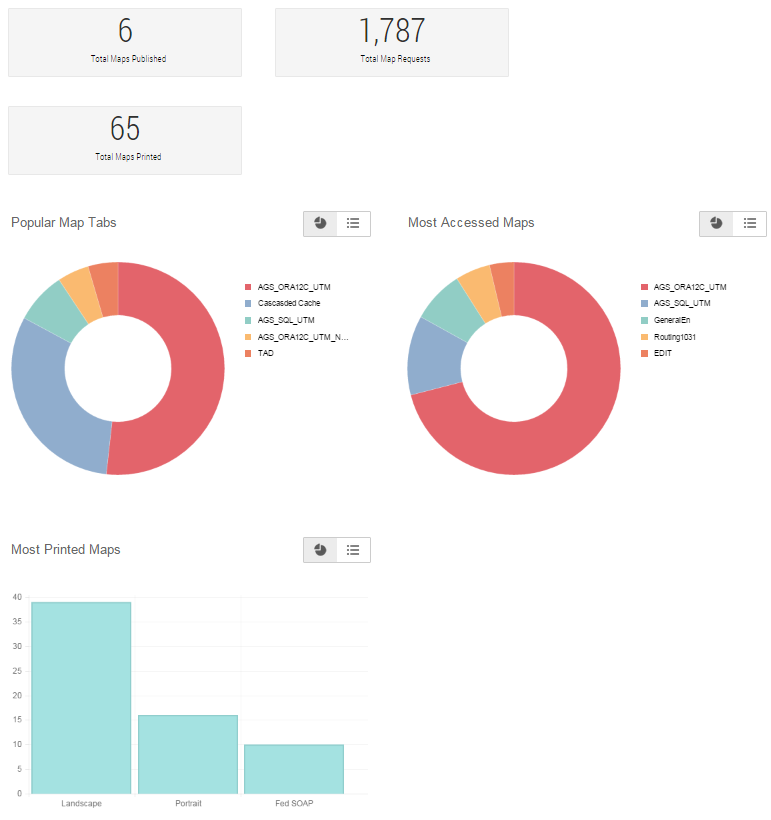
Maps
This section displays the total number of published maps, total number of map requests and total number of maps printed along with the most popular map tabs and most accessed maps.
In this example, the reports are in graphical format. For more information on viewing reports in different formats, see
Viewing the Reports in Tabular and Graphical Format.
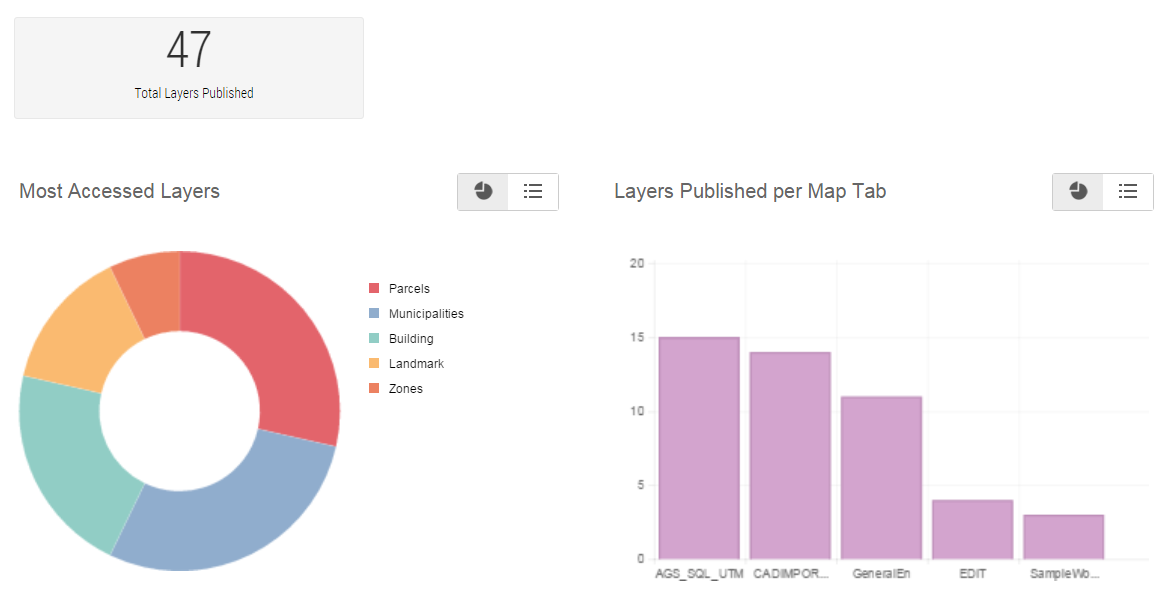
Layers
This section displays the total number of published layers, most popular map tabs and most accessed maps.
In this example, the reports are in graphical format. For more information on viewing reports in different formats, see
Viewing the Reports in Tabular and Graphical Format.
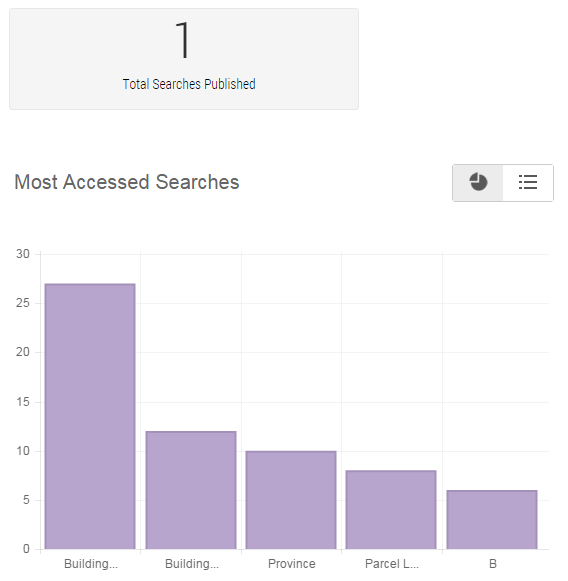
Searches
This section displays the total number of published searches and most accessed searches.
In this example, the reports are in graphical format. For more information on viewing reports in different formats, see
Viewing the Reports in Tabular and Graphical Format.
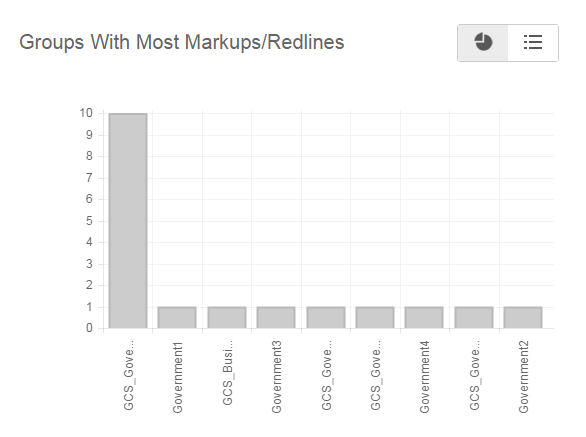
Markups
This section displays user groups by the number of markups and redlines they inserted.
In this example, the reports are in graphical format. For more information on viewing reports in different formats, see
Viewing the Reports in Tabular and Graphical Format.
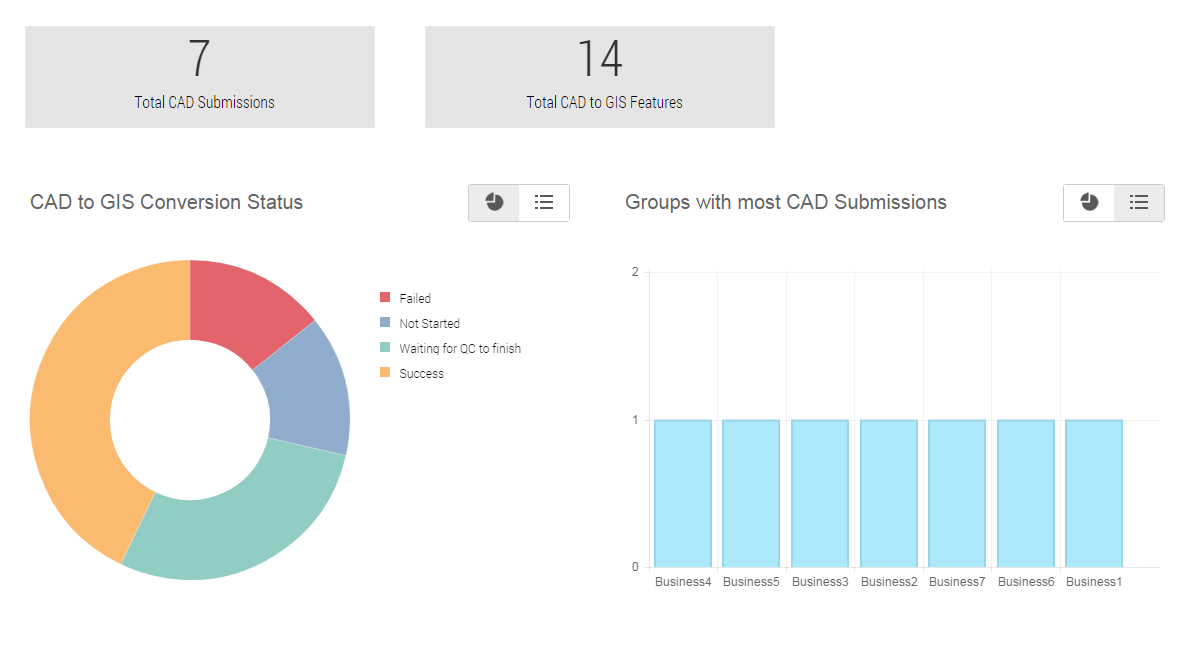
CAD
This section displays the total number of CAD submissions, groups by the number of CAD submissions, the number of CAD to GIS feature conversions and the status of CAD to GIS conversion processes by their numbers.
In this example, the reports are in graphical format.
In the CAD section, when the Groups with most CAD submissions report is displayed in tabular format, the name of organisations appear as hyperlinks. Select any hyperlink to open CAD Report for the selected organisation. For more information on viewing reports in different formats, see
Viewing the Reports in Tabular and Graphical Format.
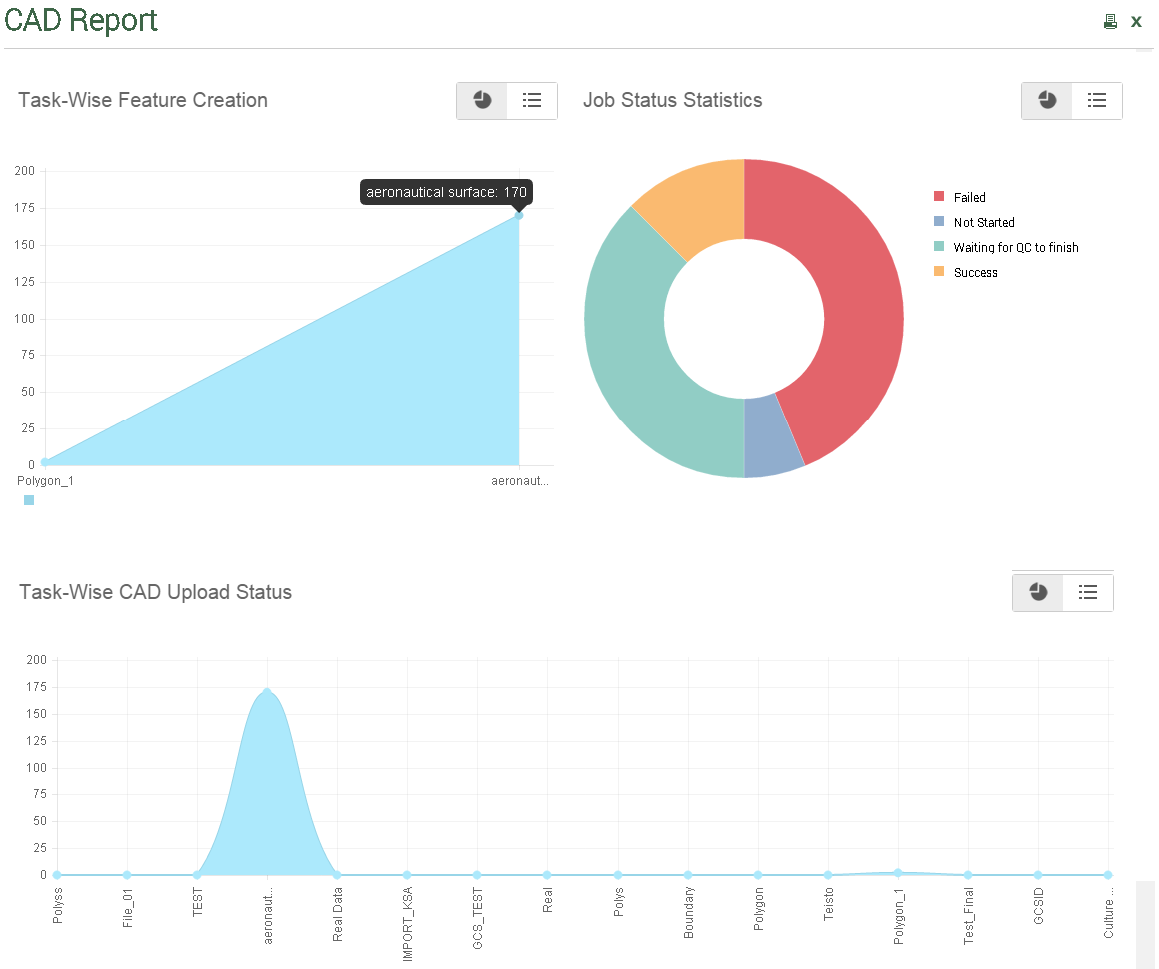
CAD Report
This report displays statistics of features extracted for each tasks, processing status of jobs and status of CAD uploaded for each tasks.
In this example, the reports are in graphical format. For more information on viewing reports in different formats, see
Viewing the Reports in Tabular and Graphical Format.
Downloads
This section displays the reports related to the downloads such as total downloads, weekly and daily download trend, downloads by region and so on.
• Total downloads
Displays the total number of downloads
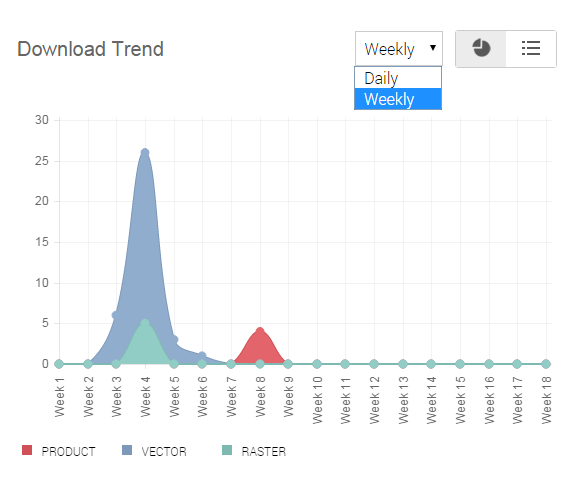
• Download trend
Displays graphical representation of daily and weekly download trend by download type
You can view the daily or weekly download trend by using the drop-down list as shown in the following figure.
In this example, the reports are in graphical format. For more information on viewing reports in different formats, see
Viewing the Reports in Tabular and Graphical Format.
• Downloads by type and user group
Displays graphical representation of most number of downloads by download type and user group