Marking up the map
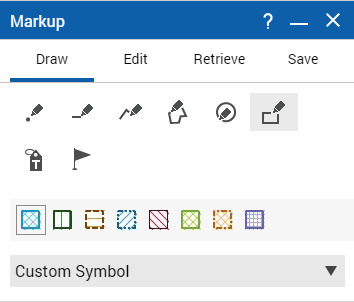
The map markup feature allows you to draw points, lines, polygons, circles and labels directly on the map for custom notes and illustrations. There is a change in the way a circle or rectangle is drawn. After adding all your custom shapes and labels to the map, you can save your markup so it can be retrieved at a later time.
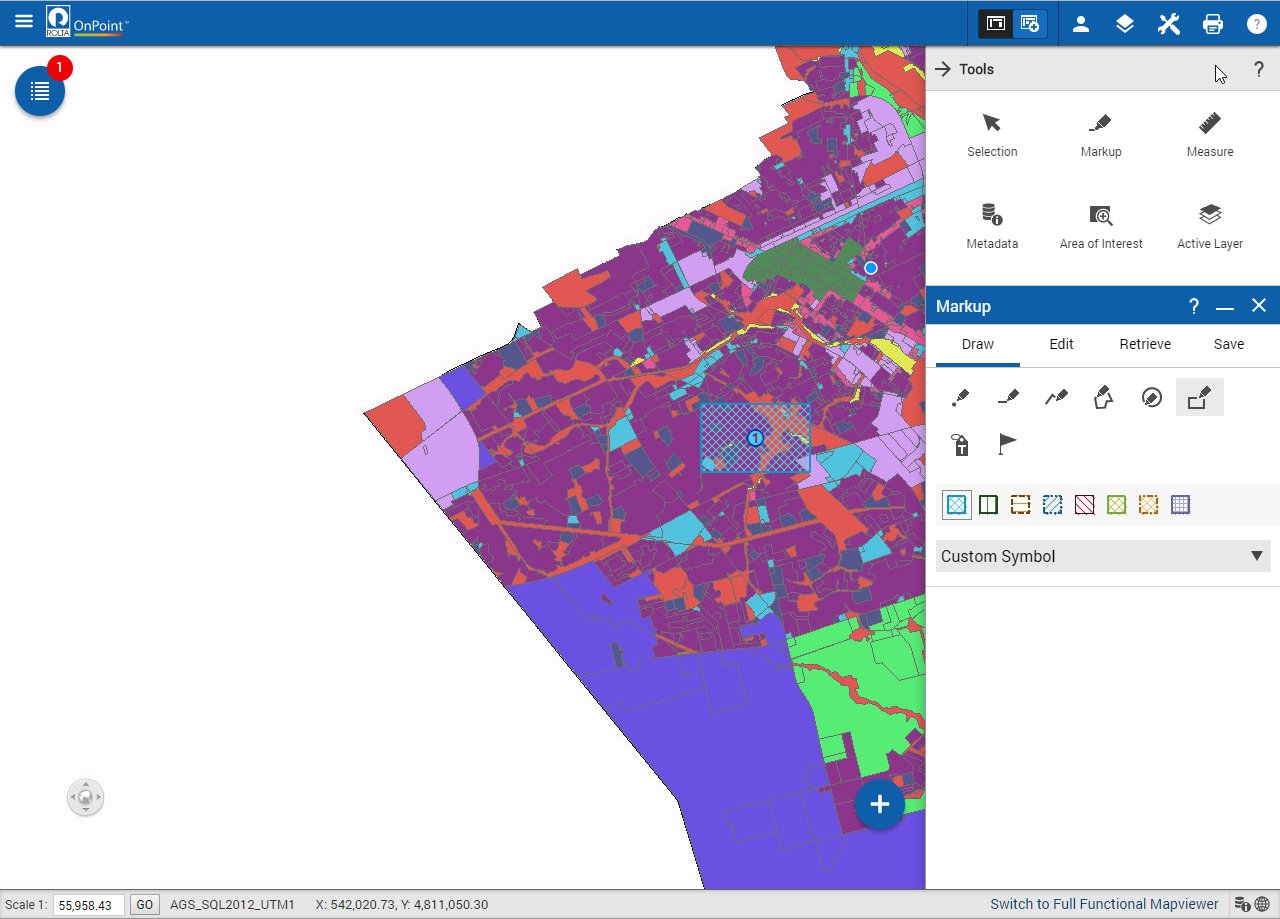
1. To open the Tools pane, from the command bar, select

.
2. From the Tools pane, select Markup.
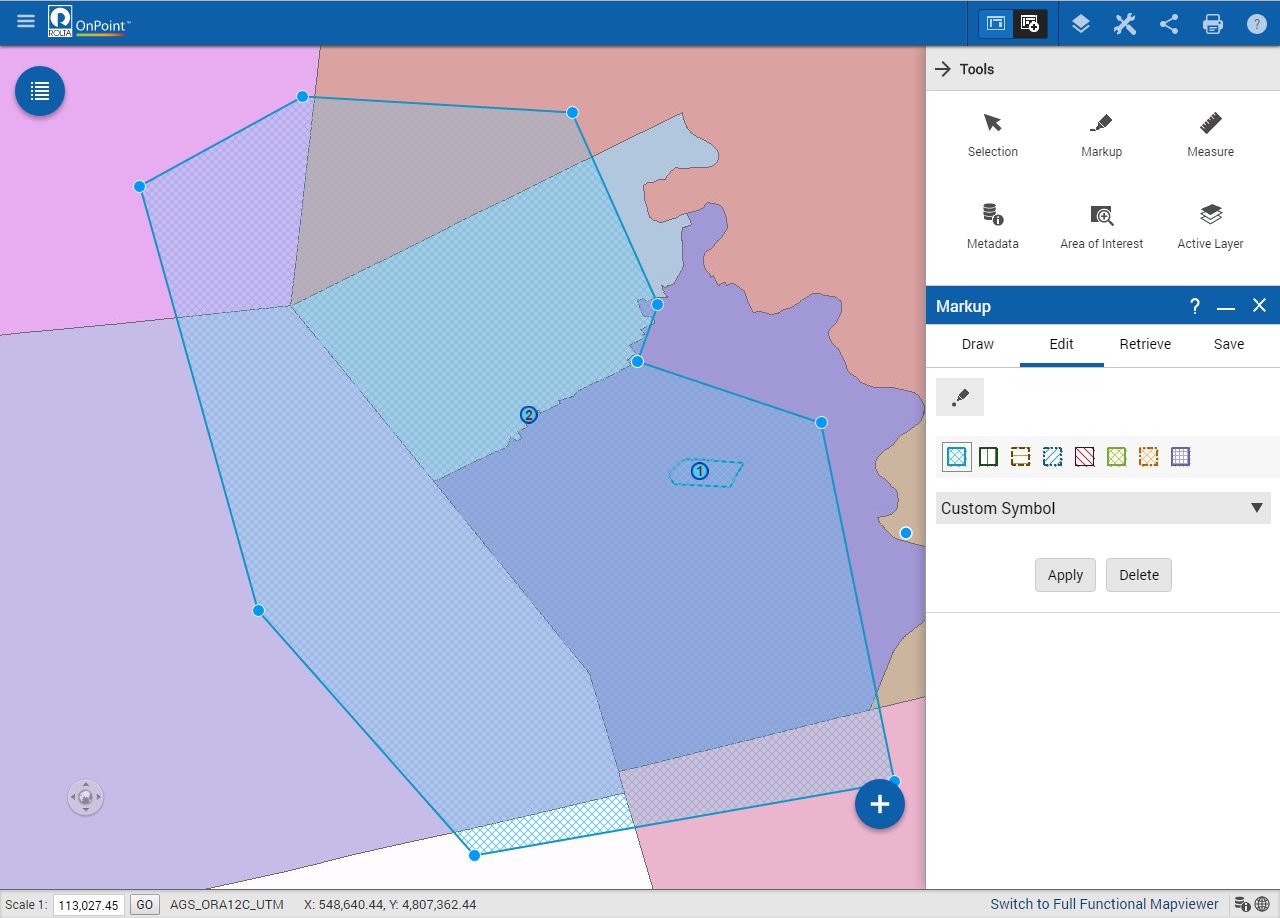
The Markup window appears containing all markup tools, symbols, and label styles that you can use to create markup shapes. If multiple symbols or label styles are available, select the type that you want to use on the map.
3. Draw the shape on the map. After you finish drawing, the Markup widget appears with a notification badge. The notification badge contains the number of newly added markups.
NOTE: | If a new markup is drawn, a notification badge with the number of newly added markups will only appear on the Markup widget if the widget is in minimized state. |
4. Click the Markup widget and the results appear in the list view, which you can also view in grid view by clicking

in the Results window.
Editing drawn shapes
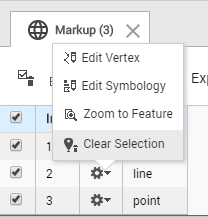
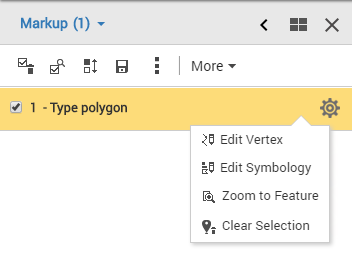
To change the shape that you have drawn on the map, use the Edit Vertex icon.
1. In the Results window, next to the data entry for the markup shape you just created:
• Select

in grid view.
• Select

in the list view.
2. Select the Edit Vertex icon

. The Markup dialog box appears and the Edit tab in the Markup dialog box is active.
NOTE: | Alternatively, to select a shape for editing, you can open the Edit tab in the Markup dialog box and select the markup shape on the map. |
3. On the map, drag the blue circles on the outline of the shape and move it to the desired location to change the shape.
4. To apply the modifications to the markup shape, select Apply.
5. To delete the shape, select Delete.
Moving a markup point
After plotting a point on the map, you can move it to a different location.
1. In the Results window, next to the data entry for the point you created:
• Select
in grid view.
• Select
in the list view.
2. Select the Edit Vertex icon
. The Markup dialog box appears and the Edit tab in the Markup dialog box is active. The Markup dialog box appears and the Edit tab is active.
NOTE: | Alternatively, to select a point, you can open the Edit tab in the Markup dialog box and select the point on the map. |
3. Drag the point to move it to a new location on the map.
4. In the Markup dialog box, select the Apply button.
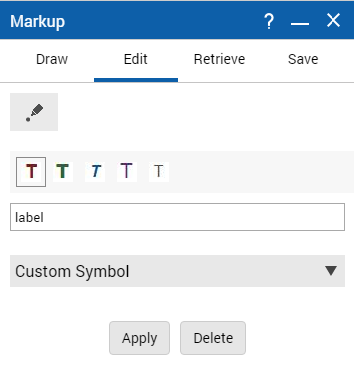
Moving a markup label
After placing a label on the map, you can move it to a different location.
1. In the Results window, next to the data entry for the point you created:
• Select
in grid view.
• Select
in the list view.
2. Select the Edit Vertex icon
. The Markup dialog box appears and the Edit tab in the Markup dialog box is active. The Markup dialog box appears and the Edit tab is active.
NOTE: | Alternatively, to select a label, you can open the Edit tab in the Markup dialog box and select the label on the map. |
3. Drag the label to move it where you want it to be located.
4. In the Markup dialog box, select the Apply button.
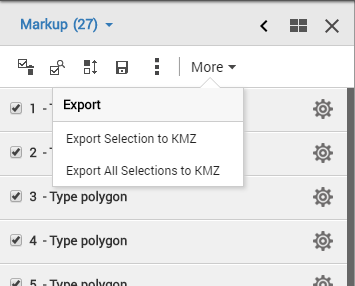
Exporting markup objects as KML files
After creating a map markup objects using one of the Markup tools, you can export them using the Export Selection to KMZ option.
NOTE: | Only the geometries of the map markup objects are exported. No attribute data is exported. |
1. In the Results window, select the More menu.
2. Scroll to the Export Selection to KMZ option. By default all markup objects you have created have their check box on the Results window selected.
3. Select the Export Selection to KMZ option. Depending on the browser you are using, you are prompted to download the resulting KML file.
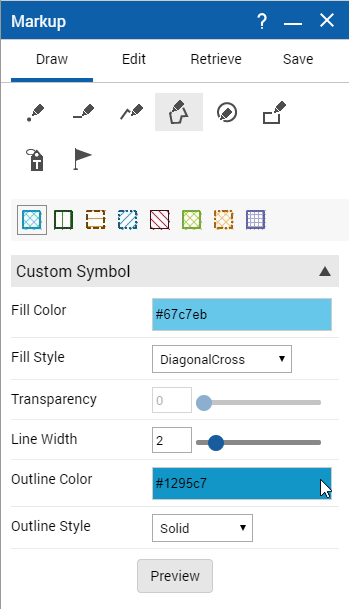
Editing map markup symbols
After drawing shapes on the map, you can change the symbols associated with the shapes you have drawn.
1. In the Results window, next to the data entry for the point you created:
• Select
in grid view.
• Select
in the list view.
2. Select the Edit Symbology icon

. The Markup dialog box appears and the Edit tab is active. In addition, the shape is selected on the map.
NOTE: | Alternatively, to select a shape to edit the symbology, you can open the Edit tab in the Markup dialog box and select the shape on the map |
3. Select a different symbol if available. If you want to change the symbol’s properties, select the Custom Style option. This displays all configurable settings for the symbol.
4. Change the symbol type, fill options, transparency or outline options. Select Preview to view the symbol preview.
5. Select Apply to save the changes.
Saving markup maps
After the markup symbols have been drawn, they can be saved as private or public. Public markup is available to all users who request publicly-saved markup selection sets, and private markup requires that you have a user account before you can access to them.
1. In the Results window, select
Save Selections 
.
NOTE: | Alternatively, you can save the markup shapes by selecting the Save tab in the Markup dialog box. |
2. In the Selection Name field, type the name of the markup map. You can optionally enter a description in the Description field.
3. Select either the Save All option to save all markup items or the Save Selected option to save only those items with the check boxes selected.
4. In the Accessibility Options field, select either Public or Private.
• The Public option allows all individuals to view this markup map while the Private option allows only you to view it.
• In the UserId field, enter your user name. This field displays if you have not logged with your user account before creating the markup map.
5. (Optional) In the Email To field, type the email address of the individual you want to email this map link to. This option requires that the email server is set up by the map administrator. The individual will require the user ID to access the map.
6. In Email From, specify the email address where you want the recipient of the map link (indicated in Email To) to be able to send a return email.
• Depending on how your map administrator has set up security and users for the OnPoint web-GIS application, your email address may automatically appear in the Email From field.
7. Select Save.
Retrieving markup maps
1. To open the Tools pane, from the command bar, select
.
2. From the Tools pane, select Markup
3. In the Markup dialog box, select the Retrieve tab. The Retrieve section is displayed.
4. In Accessibility Options, select from the options All, Private, or Public. If you select All or Private, you will be asked to enter a user ID. All public markup, as well as private markup matching the user ID will be retrieved.
5. You may enter criteria to filter the list of retrieved markup. Enter the Selection Set Name if known, or the date range that may include the required markup set.
6. Select Search to get a list of saved markup sets.
7. Select the check box for the required markup and select Display to see the saved markup set on the map.